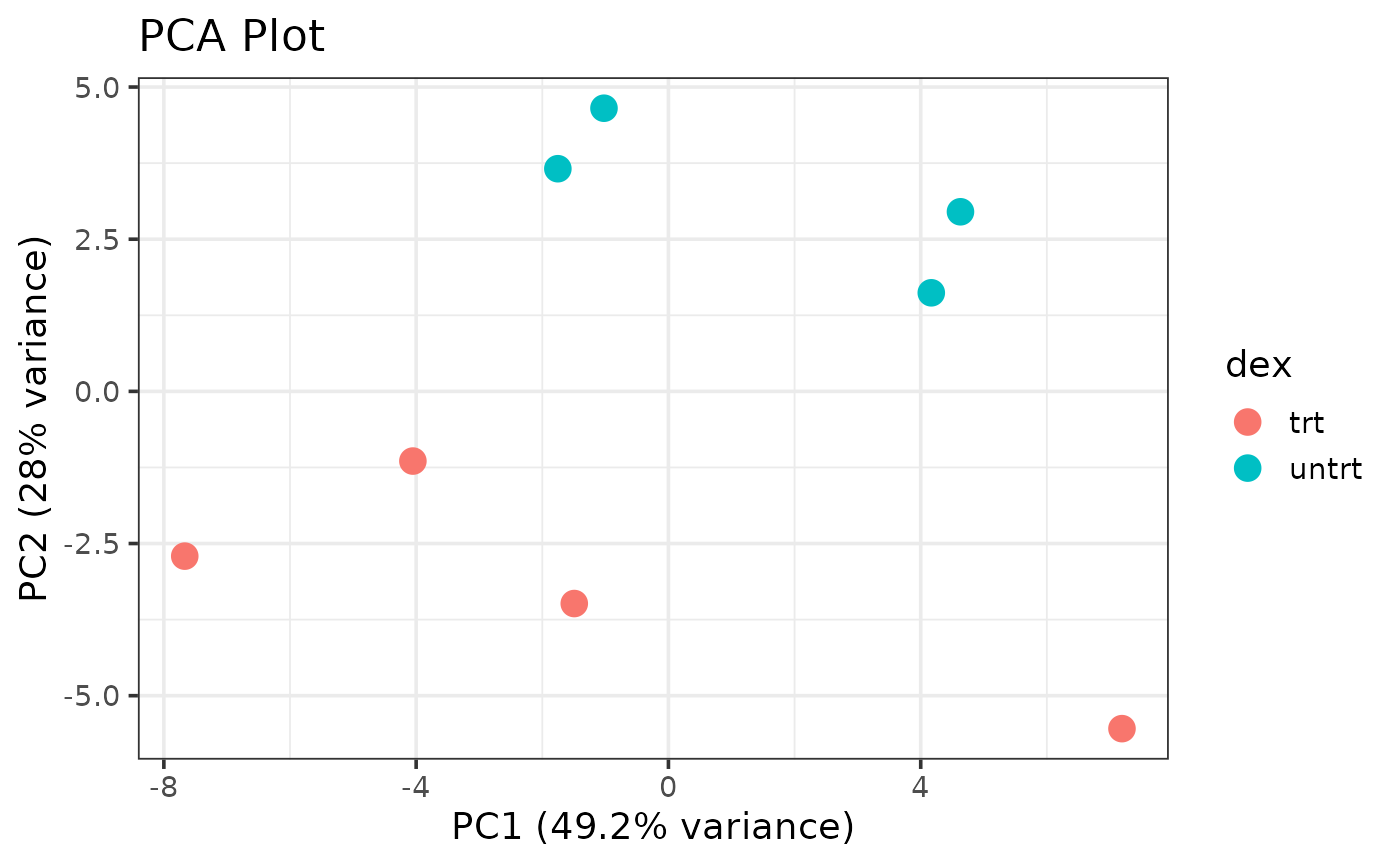
Produces a ggplot2 scatter plot of PCA scores, with optional color and shape aesthetics mapped to sample metadata columns.
Usage
plot_pca(
  pca_result,
  color_by = NULL,
  shape_by = NULL,
  pcs = c(1, 2),
  point_size = 4
)
Arguments
- pca_result
Output from
run_pca().- color_by
Column name from
colDatato map to point color. Default:NULL(no color mapping).- shape_by
Column name from
colDatato map to point shape. Default:NULL(no shape mapping).- pcs
Integer vector of length 2 specifying which PCs to plot. Default:
c(1, 2).- point_size
Numeric point size. Default: 4.
Value
A ggplot object.